AI Stock Analysis Tool: What It Does and When to Build One
An AI stock analysis tool is software that pulls market data, news, filings, and earnings material into one system, then uses statistical and language models to score, rank, and explain what it finds. It is not a crystal ball. What it does is squeeze hours of research into a shortlist you can actually read, with the reasoning attached. Below we cover how these systems work, when a subscription is enough, and what changes the bill when you order a custom build.
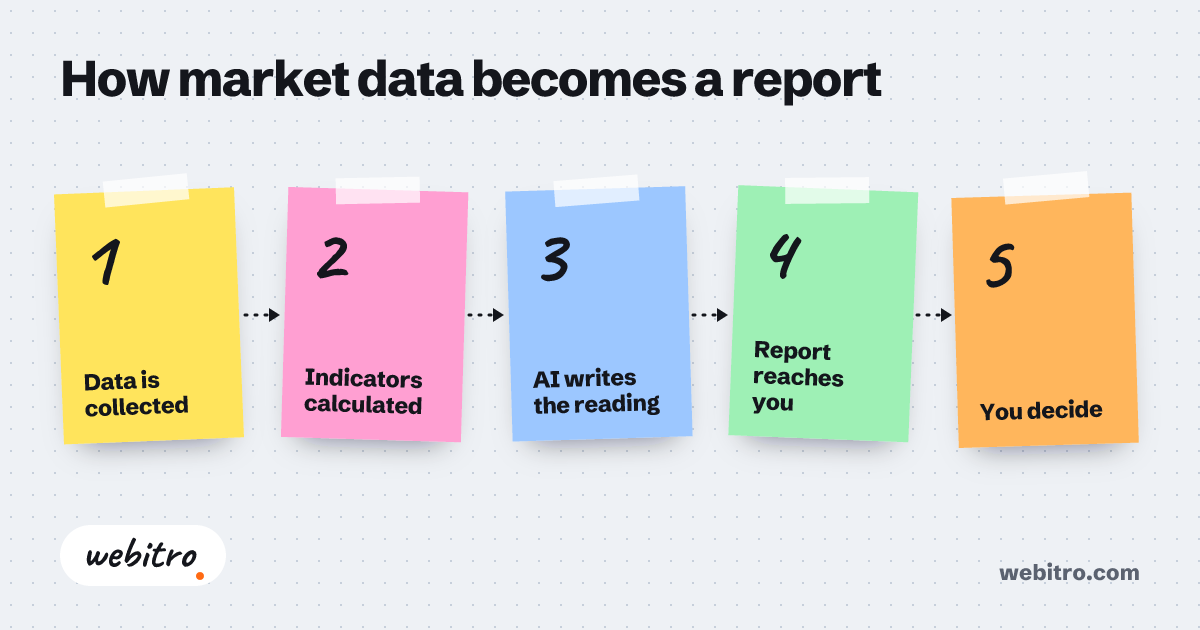
- Most AI stock analysis tools combine price and volume data with news sentiment and filing text, because numeric feeds alone miss the context that moves prices.
- A custom-built tool usually costs more up front than a subscription, but it can be tuned to a firm's own risk rules and private data instead of a generic scoring formula.
- Explainability is the dividing line between a tool you can defend in a client meeting and one you cannot, since every signal should trace back to the inputs behind it.
One more thing: read up on how AI is used for stock analysis before you sign anything.
What an AI Stock Analysis Tool Actually Does
An AI stock analysis tool gathers prices, news, filings, and earnings material, then ranks and explains which names deserve attention or caution.
A classic screener filters numbers. You set a price range, a valuation band, a moving average. An AI stock analysis tool does that and keeps going — it reads the annual report, skims the earnings call, tracks the headlines, and shows how those pieces fit together.
Most tools in this category return three things: a signal, a confidence score, and a written explanation. The explanation carries the weight. A buy flag with no reasoning is hard to trust and nearly impossible to defend when a partner or client asks why the position was taken.
Sentiment forms the second layer. News and social chatter get scored and mapped to tickers, which lets the tool flag something like a supplier disruption before it shows up in the price. Raw numbers rarely carry that kind of context on their own.
The third layer is comparison. The tool lines a company up against its sector, its own five-year history, and peer filings, then rolls that into portfolio views — concentration, correlation, and exposure to a single theme.
For active traders, this runs intraday. For long-term investors and advisors, it runs weekly or around earnings. In both cases the goal is to shorten the research slog, not to replace the person reading the output.
How the Engine Works Under the Hood
Under the hood, the tool ingests and normalizes data feeds, runs quantitative and language models side by side, then applies your own rules to whatever comes out.
Everything starts with data. Market feeds supply prices, volume, and depth. Filings arrive from EDGAR, transcripts from earnings calls, headlines from news APIs. Each source has its own format and its own delay, so cleaning and aligning them is the first real engineering job.
Once the data is consistent, the modeling splits in two directions. Quant models work on time series — momentum, volatility, mean reversion, factor exposure. Language models work on text — sentiment, risk wording, changes in guidance, management tone.
Then the rules go in. This is where you decide what the system should care about: a maximum position size, a sector cap, a blackout window around earnings. The tool applies those automatically and keeps a log of every decision it makes.
Orchestration holds the loop together. Scheduled jobs pull fresh data, models re-score overnight, and alerts land in email, Slack, or a dashboard. None of that is exotic, but the reliability of that loop separates a working tool from a weekend demo.
Off-the-Shelf Platform or Custom Build?
A subscription platform gets you running fast and cheap, while a custom build wins when your strategy, private data, or audit rules do not fit a generic scoring model.
A subscription platform is the right first stop if you want to test whether AI signals help your process at all. You get a login, a watchlist, and a daily digest within the hour, with no engineering time involved.
The wall shows up later. Generic models rank stocks by criteria that are not yours. You cannot change the formula, add a private data source, or push the output into your own risk system. You also cannot show anyone exactly how a score was produced.
A custom build flips that. You define the factors, the weighting, the alert thresholds, and the audit trail. Private data — your trade history, research memos, CRM notes — can feed the model, and that is often where the real edge sits.
If you want a sense of what a tailored build looks like in practice, our AI stock and crypto analysis service covers the data pipeline, the models, and the delivery layer as one project.
What Drives the Cost and the Timeline
Cost and schedule track three things: how many data sources you license, how custom the models are, and how much compliance and reporting work sits on top.
Data licensing is usually the first cost line. Free feeds are delayed and thin. Real-time feeds, transcript archives, and fundamentals databases are sold by subscription, and pricing scales with users and with how many exchanges you cover.
Model work comes next. Reusing a well-known factor model is quick. Training something specific to a niche — small-cap biotech, regional banks, utilities — takes labeled data and patient backtesting. Backtests that look brilliant and fail live are the most common way these projects lose money.
Then there is delivery. A dashboard, alerts, an API, a mobile view — each one adds interface work. If the tool has to talk to an existing portfolio or order system, integration and permission work grows quickly.
Compliance and audit trails add time as well, especially when the tool serves clients rather than just you. Logging, explainability, and access control belong in the build, not bolted on afterward. For a broader view of how scope turns into budget, our breakdown of custom software cost covers the main drivers.
Asset coverage shifts the work too. The same pipeline extends to digital assets, and our write-up on AI crypto analysis covers where crypto data sources and market hours behave differently.
What to Check Before You Commit
Before you commit, confirm where the data comes from, whether every signal can be explained, and how easily you can walk away with your own history.
Ask where the data comes from and how fresh it is. A tool scoring a stock on last week's headlines is not analyzing anything; it is doing archaeology. Delays and refresh windows should be stated in plain language.
Ask for explainability. Every signal should trace back to the inputs behind it. If nobody can show you that trail, you are buying a black box that will not survive one meeting with a skeptical partner.
Ask about backtesting discipline. Walk-forward tests, out-of-sample periods, and realistic trading costs matter far more than one impressive return figure. Models tuned to the past fall apart the moment the market regime shifts.
Ask about ownership and export. Your watchlists, notes, and data history should come out in a usable format if you leave. And keep the boundaries clear: an AI stock analysis tool surfaces patterns and risks — it does not promise returns or stand in for a licensed advisor.
One more thing: read up on how AI is used for stock analysis before you sign anything. Understanding the modeling choices shortens every vendor conversation you have afterward.
If you want a sense of what a tailored build looks like in practice, our AI stock and crypto analysis service covers the data pipeline, the models, and the delivery layer as one project.
Frequently Asked Questions
Do I need coding skills to use an AI stock analysis tool?
No. Subscription tools are point-and-click, and a custom build should arrive with a dashboard your team can run without touching code.
Can an AI stock analysis tool predict prices?
It can estimate probabilities and flag conditions that historically came before certain moves, but no model reliably calls tomorrow's price. Treat the output as evidence, not prophecy.
Is this the same thing as a trading bot?
Not really. Analysis tools score, rank, and explain. Trading bots place orders. Some systems do both, but the scoring layer and the execution layer are separate pieces of work.
How long does a custom analysis tool take to build?
It depends on scope. A focused tool with one or two data feeds moves quickly, while a multi-asset platform with client reporting and audit trails takes considerably longer, so most builds ship in phases.
Does the same approach work for crypto?
Yes, with adjustments. Digital asset data is noisier, markets never close, and volatility behaves differently, so scoring thresholds and alert timing usually need their own tuning.